The Proposal
I started my proposal following the examples in the Student Guide. They can be found here and here. To begin with, I created a Google Docs file, in order to make it easy for Arviz core developers to comment and review the proposal draft.
I had many problems trying to write a coherent timeline, because I was not an expert in ArviZ nor in the algorithms involved. Thus, I had nearly no previous relevant experience to use as “timing guide”. Therefore, I found my contributions to ArviZ -prior to writing the proposal- to be an invaluable help when writing the timeline. I spent several days working on the proposal alone and once I was relatively happy with the draft I shared it with the ArviZ community.
After receiving the comments of the possible mentors, I started paying more attention to the format of the proposal. I created a GitHub repo to continue developing the proposal, now following the format of the NumFOCUS template. The generated proposal follows quite closely the template except in the timeline section.
I felt that the timeline explained as a list of tasks with some planned start and end date did not provide a good idea of the time dedicated to each task nor the relations between them. Therefore I decided to use a Gantt chart to make the timeline more visual and easy to follow.
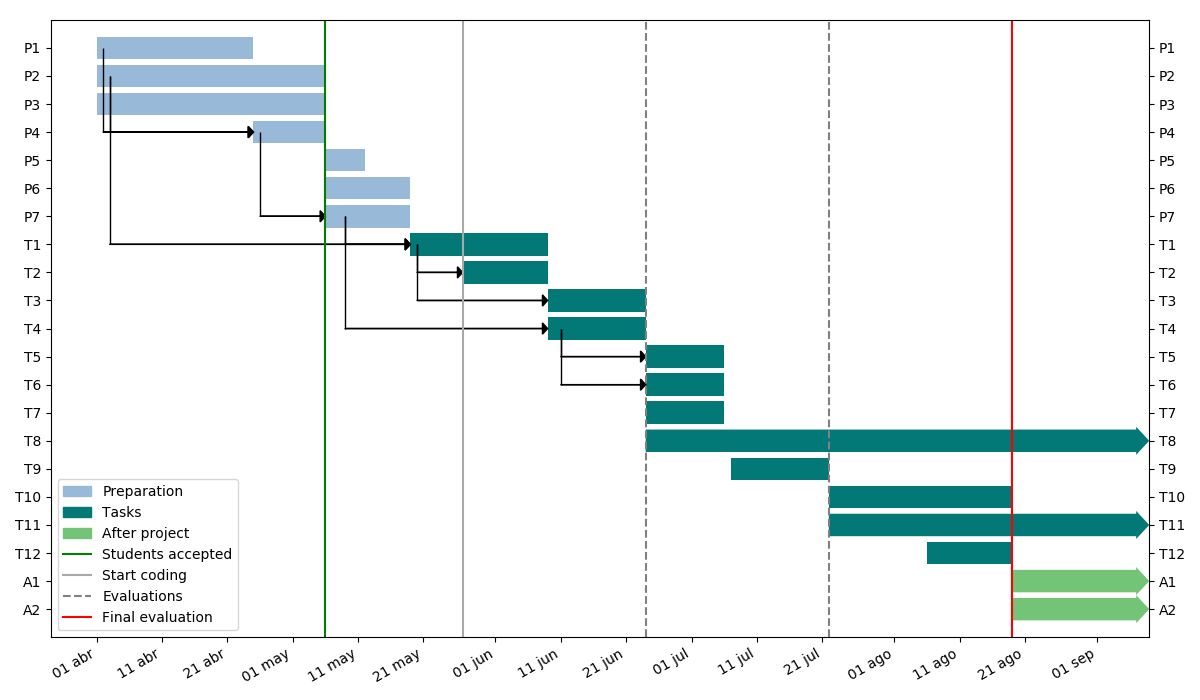
This Gantt chart was built with matplotlib. It allows the reader to distinguish clearly between the different task types as well as their length and relations. Moreover, it shows the key dates of the program which can be identified at first glance. The explanation of the labels can be found in the complete proposal. Below there is the code used to generate the Gantt Chart:
import matplotlib.pyplot as plt
import matplotlib.dates as md
import matplotlib.patches as mpatch
import matplotlib.lines as mlines
import pandas as pd
import numpy as np

def mpl_date(x):
    return md.date2num(pd.to_datetime(x, format='%d-%m-%Y'))

# Define task start and end date
tasks = {'P1' : ['1-4', '25-4', 1],
         'P2' : ['1-4', '6-5', 2],
         'P3' : ['1-4', '6-5', 3],
         'P4' : ['25-4', '6-5', 1],
         'P5' : ['6-5', '12-5', 1],
         'P6' : ['6-5', '19-5', 2],
         'P7' : ['6-5', '19-5', 3],
         'T1' : ['19-5', '9-6', 1],
         'T2' : ['27-5', '9-6', 1],
         'T3' : ['9-6', '24-6', 1],
         'T4' : ['9-6', '24-6', 2],
         'T5' : ['24-6', '6-7', 1],
         'T6' : ['24-6', '6-7', 2],
         'T7' : ['24-6', '6-7', 3],
         'T8' : ['24-6', '30-12', 4],
         'T9' : ['7-7', '22-7', 1],
         'T10' : ['22-7', '19-8', 1],
         'T11' : ['22-7', '30-12', 2],
         'T12' : ['6-8', '19-8', 1],
         'A1' : ['19-8', '30-12', 1],
         'A2' : ['19-8', '30-12', 2]}
# define dict with task relations
dependencies = {'P4' : ['P1', 'P2'],
                'P7' : ['P4'],
                'T1' : ['P2', 'P7'],
                'T2' : ['T1'],
                'T3' : ['T1'],
                'T4' : ['P7'],
                'T5' : ['T4'],
                'T6' : ['T4']}
# Define task dataframe
df_whole = pd.DataFrame.from_dict(
    tasks,
    orient='index',
    columns=['Start_date', 'End_date', 'offset']
)
df = df_whole[['Start_date', 'End_date']] + '-2019'
df = df.apply(lambda col: pd.to_datetime(col, format='%d-%m-%Y'), axis=0)
# Define colors
color_code = {
    'P': (0.6015686274509804, 0.7254901960784313, 0.8494117647058823, 1.0),
    'T': (0.006274509803921568, 0.4729411764705882, 0.46431372549019606, 1.0),
    'A': (0.45176470588235296, 0.7670895809304115, 0.4612072279892349, 1.0)
}
colors = pd.Series(df.index).apply(lambda x: color_code[x[0]]).values
# define a boolean array, True for arrow-like tasks, rectangle otherwise
start = mpl_date(df.Start_date.values)
end = mpl_date(df.End_date.values)
y_values = np.arange(len(tasks))[::-1]
barhwidth = 0.8
mask = end<mpl_date('9-9-2019')
# Plot
# Plot rectangular tasks
fig, ax = plt.subplots(1,1,figsize=(12,7))
ax.barh(y_values[mask],
        (end-start)[mask],
        left=start[mask],
        align='center',
        color=colors[mask],
        edgecolor=None,
        height=barhwidth)
# Plot arrow tasks
for task in df.index.values[end>mpl_date('1-11-2019')]:
    mask = df.index==task
    x_start = start[mask][0]
    x_end = mpl_date('9-9-2019')
    y_start = y_values[mask][0]
    ax.arrow(x_start,
             y_start,
             x_end-x_start,
             0,
             facecolor=color_code[task[0]],
             width=barhwidth,
             head_length=2,
             head_width=0.2+barhwidth,
             length_includes_head=True,
             linewidth=0)
# Plot key dates
ax.axvline(mpl_date('6-5-2019'),color='g')
ax.axvline(mpl_date('27-5-2019'),color='darkgrey')
ax.axvline(mpl_date('24-6-2019'),color='grey',ls='--')
ax.axvline(mpl_date('22-7-2019'),color='grey',ls='--')
ax.axvline(mpl_date('19-8-2019'),color='red')
# Plot dependency arrows
for child, parents in dependencies.items():
    mask = df.index == child
    x_end = start[mask][0]
    y_end = y_values[mask][0]
    for parent in parents:
        mask = df.index == parent
        x_start = start[mask][0]+df_whole.offset[mask][0]
        y_start = y_values[mask][0]
        dx = x_end - x_start
        dy = y_end - y_start
        kwargs = {'edgecolor':None,'facecolor':'k','length_includes_head':True}
        ax.arrow(x_start,y_start,0,dy,width=0.001,head_length=0,head_width=0,**kwargs)
        ax.arrow(x_start,y_start+dy,dx,0,width=0.001,head_length=0.8,head_width=0.4,**kwargs)

# Format axis
ax.xaxis.set_major_formatter(md.DateFormatter('%d %b'))
ax.xaxis.set_major_locator(md.DayLocator(bymonthday=[1, 11, 21]))
ax.set_xlim(mpl_date(['25-3-2019','9-9-2019']))
ax.set_yticklabels(df.index)
ax.set_yticks(y_values)
ax.set_ylim(y_values[-1]-1, y_values[0]+1)
ax.tick_params(axis='y', labelleft=True, labelright=True, left=True, right=True)

# Create personalized legend
leg = []
names = ['Preparation', 'Tasks', 'After project']
for color,name in zip(color_code.values(),names):
    leg.append(mpatch.Patch(color=color,label=name))
lines = [['Students accepted', 'g', '-'],
         ['Start coding', 'darkgrey', '-'],
         ['Evaluations', 'grey', '--'],
         ['Final evaluation', 'red','-']]
for line in lines:
    leg.append(mlines.Line2D([], [], color=line[1], label=line[0],linestyle=line[2]))

ax.legend(handles=leg)
fig.autofmt_xdate()
fig.tight_layout()